my energy community
Frequently asked questions
1. What are the benefits of real-time data?
The main advantage of real-time data is the availability of historical and current measurement data, and the ability to monitor and control and adjust one’s electricity consumption.
2. What data is available to the user?
The user has access to measurement data on power consumed, power produced, voltage, current and electrical energy according to individual tariffs.
3. What is the time interval of the data?
The user can choose the desired time interval – 15-minute, daily, weekly or monthly.
4. What is the resolution of the available measurement data?
The measurement data on the graph shows the data in the selected measurement interval. More detailed information is available to the user when exporting data by clicking on the “EXPORT” icon.
![]()
5. What does the power consumed graph show?
The consumed power graph shows the energy that the user takes from the power grid in the time interval t. The measurement unit for power is the watt (symbol: W).
6. What does the power produced graph show?
The power produced graph shows the energy that the user with his own production delivers to the power grid in the time interval t. The unit of measurement for power is the watt (symbol: W).
7. What do L1, L2 and L3 mean?
L1, L2 and L3 indicate the three-phase wires of a user with a three-phase meter.
8. What do tariff 1 and tariff 2 mean?
Tariff 1 indicates a higher tariff and tariff 2 indicates a lower tariff. The schedule of daily tariffs is defined for:
– Winter time: high tariff 7:00 – 21:00, low tariff 21:00 – 7:00
– Summer time: high tariff 8:00 – 22:00, low tariff 22:00 – 8:00
9. What is a limiter?
The limiter is a device by which the maximum power of simultaneously switched electrical devices at the end customer is limited to the size defined by the power agreement by HEP ODS. The power of the limiter is determined according to the rated power of the connection to the network.
10. What does the power graph show?
Power is the change in energy per unit of time. The relation between power and electricity is shown by the formula: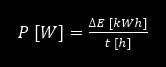
my energy community contact
Send inquiry
Get in touch, we'll be glad to answer all your questions.
powered by
![]()